Pandas Series and DataFrame Basics:
- Pandas is an open-source library for data analysis.
- It gives Python the ability to work with spreadsheet-like data for fast data loading, manipulating, slicing, grouping, etc.
- Pandas introduces two new data types to Python: Series and DataFrame.
- The DataFrame will represent your entire spreadsheet or rectangular data, whereas the Series is a single column of the DataFrame.
- In other words, Series are one-dimensional arrays of data, and DataFrames are two-dimensional arrays of data that are roughly similar to a spreadsheet.
- A Pandas DataFrame can also be thought of as a dictionary or collection of Series.
- The DataFrame will represent your entire spreadsheet or rectangular data, whereas the Series is a single column of the DataFrame.
The pandas DataFrame Anatomy:
- Visually, the outputted display of a pandas DataFrame (in a Jupyter Notebook) appears to be nothing more than an ordinary table of data consisting of rows and columns.
- Hiding beneath the surface are the three components - the index, columns, and data that you must be aware of to maximize the DataFrame’s full potential.
- The below reads in the movie dataset into a pandas DataFrame and provides a labeled diagram of all its major components.
python
1import pandas as pd
2
3df = pd.read_csv('./data/movie.csv')
4print(df)
Output (some columns hidden here for readability — the real output has 28):
1      color      director_name  duration  ...  imdb_score  movie_facebook_likes
2   0  Color      James Cameron     178.0  ...         7.9                 33000
3   1  Color     Gore Verbinski     169.0  ...         7.1                     0
4   2  Color         Sam Mendes     148.0  ...         6.8                 85000
5   3  Color  Christopher Nolan     164.0  ...         8.5                164000
6   4    NaN        Doug Walker       NaN  ...         7.1                     0
7 ...    ...                ...       ...  ...         ...                   ...
84911  Color        Scott Smith      87.0  ...         7.7                    84
94912  Color                NaN      43.0  ...         7.5                 32000
104913  Color   Benjamin Roberds      76.0  ...         6.3                    16
114914  Color        Daniel Hsia     100.0  ...         6.3                   660
124915  Color           Jon Gunn      90.0  ...         6.6                   456
13
14[4916 rows x 28 columns]
Anatomy:
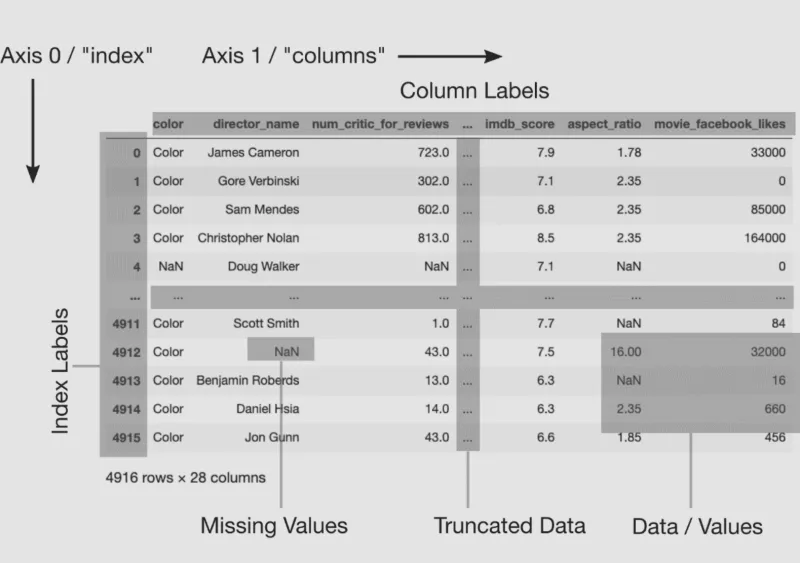
- The labels in index and column names allow for pulling out data based on the index and column name. We will show that later in the semester.
- Index is axis 0 and the columns are axis 1.
- Pandas uses NaN (not a number) to represent missing values.
Load Your Data Set:
- Similar to the above example, since Pandas is not part of the Python standard library, we have to first tell Python to load the library.
- Then, with the library loaded, we can use the read_csv() function from pandas by using the “dot notation”.
- In respect to the path, the ”.” (dot) represents the current directory, which is the directory where the Python notebook is located. The ”/” divides different parts of the file path, indicating a step into a directory.
python
1import pandas as pd
2
3df = pd.read_csv('./data/IthacaDailyClimate2018.csv')
4print(df)
Output (some columns hidden here for readability — the real output has 7):
1           Date  Maximum Temperature  ...  Snowfall  Snow Depth
20    2018-01-01                    5  ...       1.0         3.0
31    2018-01-02                   13  ...       0.6         4.0
42    2018-01-03                   19  ...       0.0         4.0
53    2018-01-04                   22  ...       0.0         3.0
64    2018-01-05                   18  ...       1.2         4.0
7..          ...                  ...  ...       ...         ...
8360  2018-12-27                   33  ...       0.0         1.0
9361  2018-12-28                   40  ...       0.0         0.0
10362  2018-12-29                   50  ...       0.0         0.0
11363  2018-12-30                   37  ...       0.7         1.0
12364  2018-12-31                   35  ...       0.0         0.0
13
14[365 rows x 7 columns]
DataFrame Type:
- We can check to see if we are working with a Pandas DataFrame by using the built-in type() function.
python
5print(type(df))- The type() function is handy when you begin working with many different types of Python objects and need to know what object you are currnetly working on.
Output:
1<class 'pandas.core.frame.DataFrame'>DataFrame Attributes:
- The shape attribute returns a tuple where the first value is the number of rows and the second value is the number of columns.
- Since .shape is an attribute of the DataFrame objects, and not a function or method of the DataFrame objects, it does not have round parentheses after the period.
.shape attribute
python
1import pandas as pd
2
3df = pd.read_csv('./data/IthacaDailyClimate2018.csv')
4print(df.shape)
Output:
1(365, 7)- To get a gist of what information the data set contains, we look at the column names. The column names, like .shape, are given using the .column attribute of the DataFrame objects.
- Each column (i.e., Series) has to be the same type, whereas each row can contain mixed types.
- However, it’s best to make sure that is the case by using the .dtypes attribute or the .info() method.
.dtypes attribute
python
4# get the dtype of each column
5print(df.dtypes)
Output:
1Date                    object
2Maximum Temperature      int64
3Minimum Temperature      int64
4Average Temperature    float64
5Precipitation          float64
6Snowfall               float64
7Snow Depth             float64
8dtype: object
.info() method
python
4# get more information about our data
5print(df.info())
Output:
1<class 'pandas.core.frame.DataFrame'>
2RangeIndex: 365 entries, 0 to 364
3Data columns (total 7 columns):
4  #   Column               Non-Null Count  Dtype
5 ---  ------               --------------  -----
6 0   Date                 365 non-null    object
7 1   Maximum Temperature  365 non-null    int64
8 2   Minimum Temperature  365 non-null    int64
9 3   Average Temperature  365 non-null    float64
10 4   Precipitation        365 non-null    float64
11 5   Snowfall             365 non-null    float64
12 6   Snow Depth           365 non-null    float64
13dtypes: float64(4), int64(2), object(1)