Ex 4.6 Formatting Bar Chart Labels:
Objective: Learn to add and format bar chart labels.
- Create a new Jupyter Notebook file and name it Ex4.6_FormattingBarChartLabels.ipynb.
- Work through parts 1 through 4 below and submit your completed Jupyter Notebook (.ipynb) file to the first quiz question on Canvas. Your notebook should include both your code and the corresponding output that match the screengrabs provided below. Be sure to run all cells so that every output appears in the notebook.
Part 1:
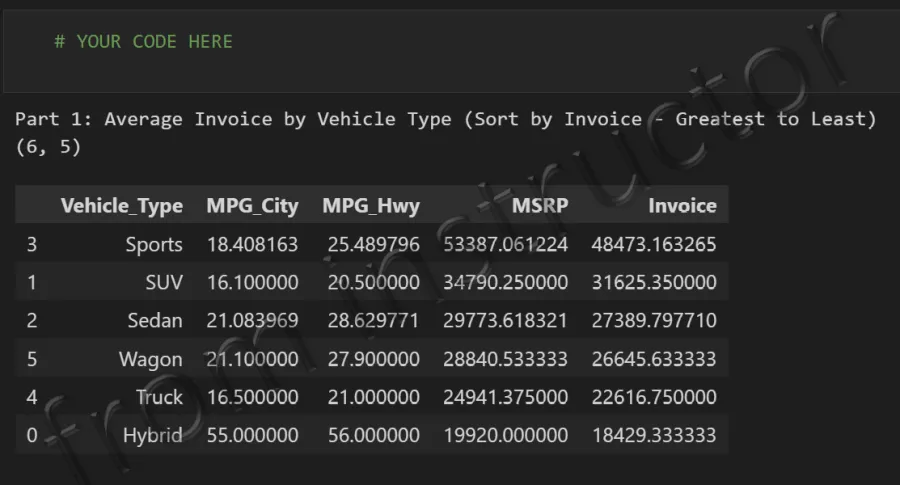
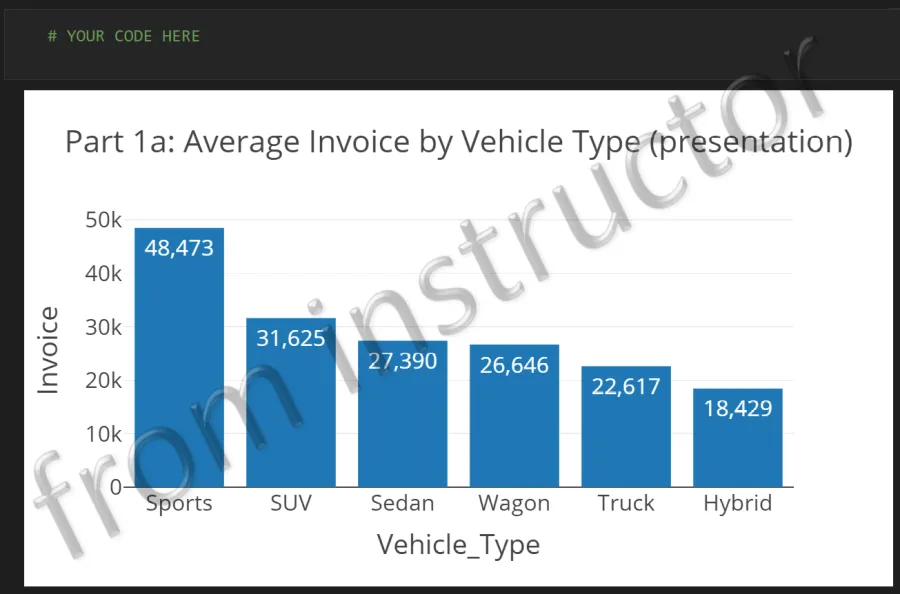
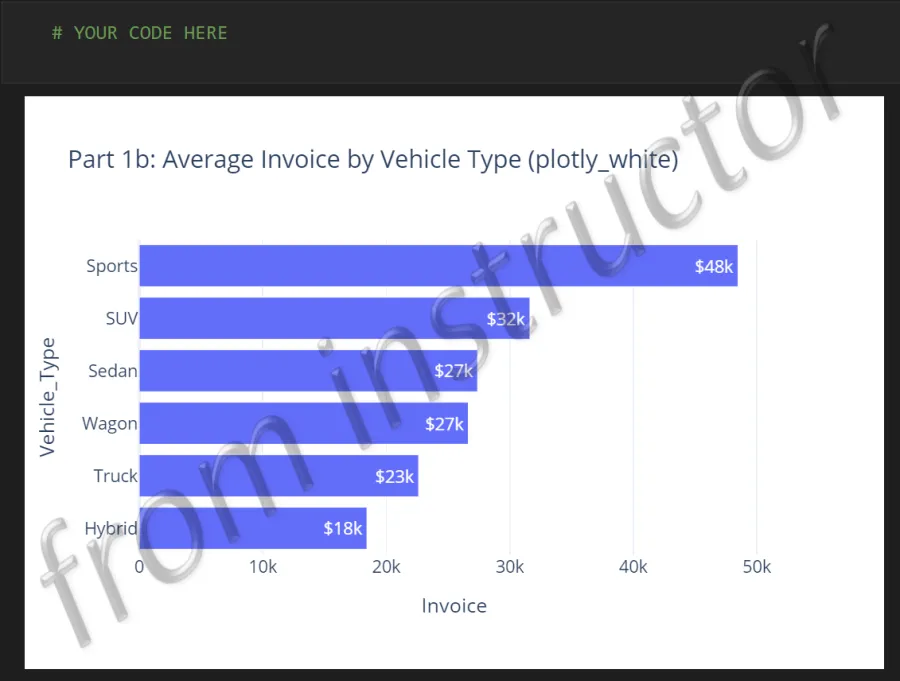
- Use the Cars.csv data file to answer the following question and create the two bar charts shown below.
- What is the Average Invoice by Vehicle Type? (Sort by Invoice - Greatest to Least)
Part 2:
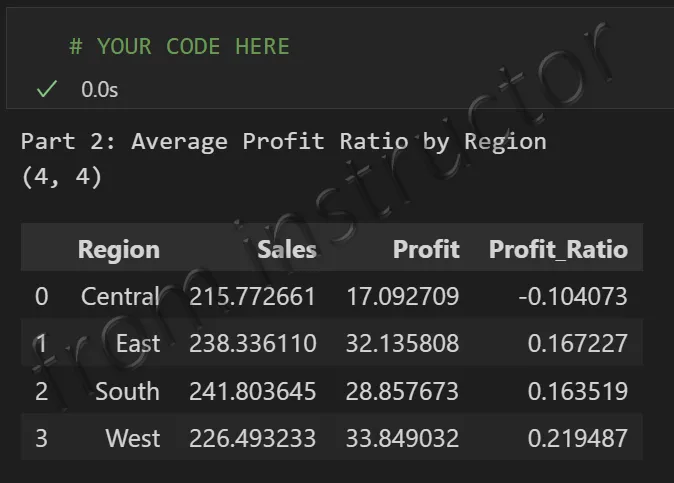
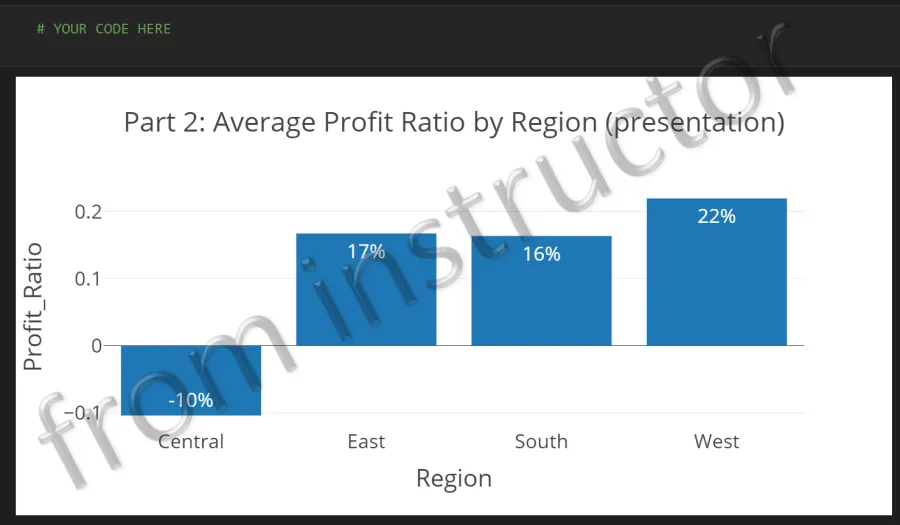
- Use the Sample - Superstore.xlsx data file to answer the following question and create the bar chart shown below.
- What is the Average Profit Ratio by Region?
- Note: Calculate the Profit Ratio before you use groupby.
- Here’s the formula to use:
df['Profit_Ratio'] = df['Profit'] / df['Sales']
- Here’s the formula to use:
- Note: Calculate the Profit Ratio before you use groupby.
- What is the Average Profit Ratio by Region?
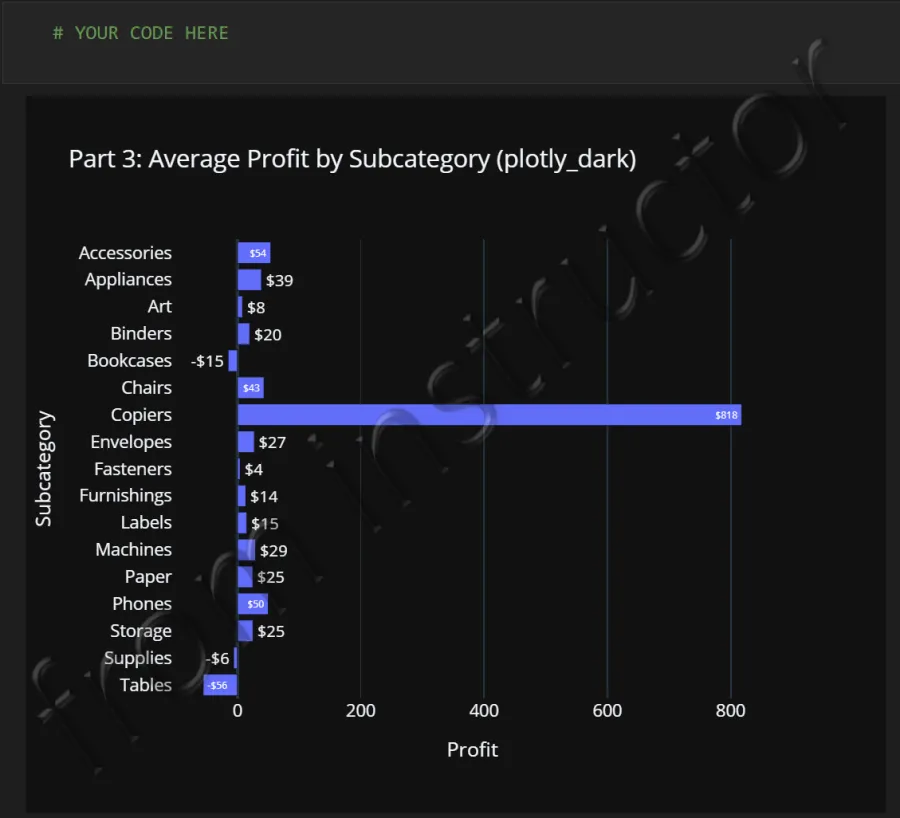
Part 3:
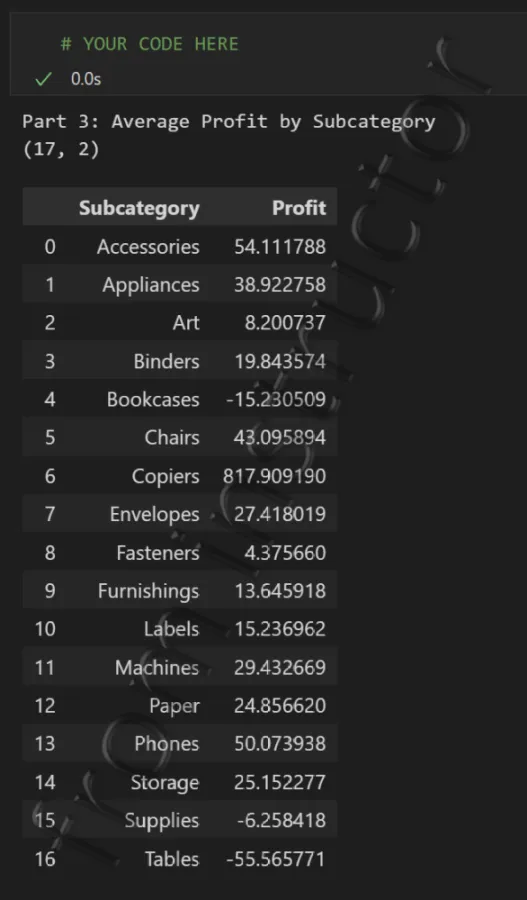
- Continue using the Sample - Superstore.xlsx data file to answer the following question and create the bar chart shown below.
- What are the Average Profits by Subcategory?
Part 4:
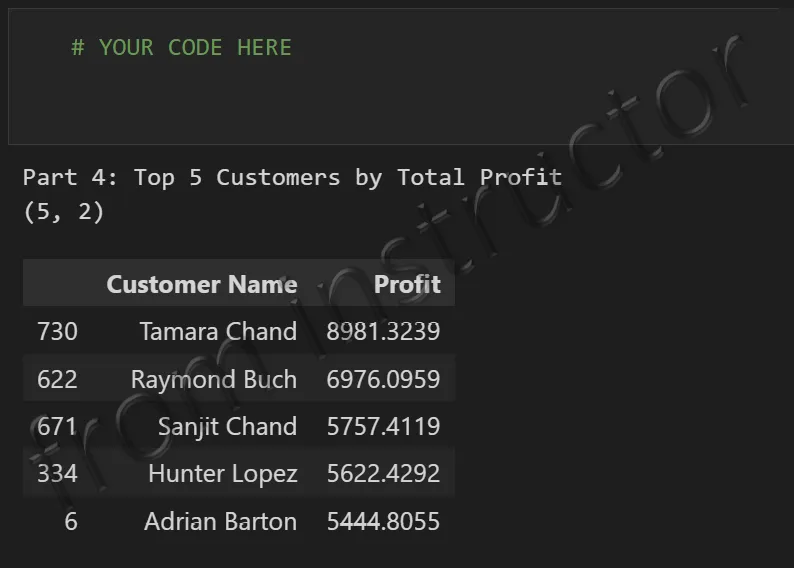
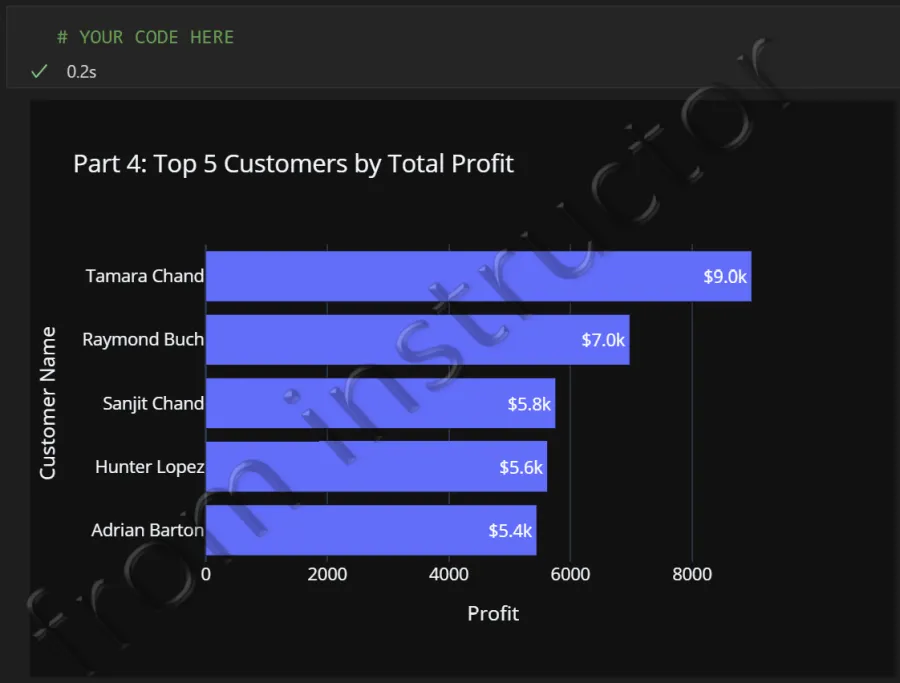
- Continue using the Sample - Superstore.xlsx data file to answer the following question and create the bar chart shown below.
- Which 5 customers generate the highest total profits?